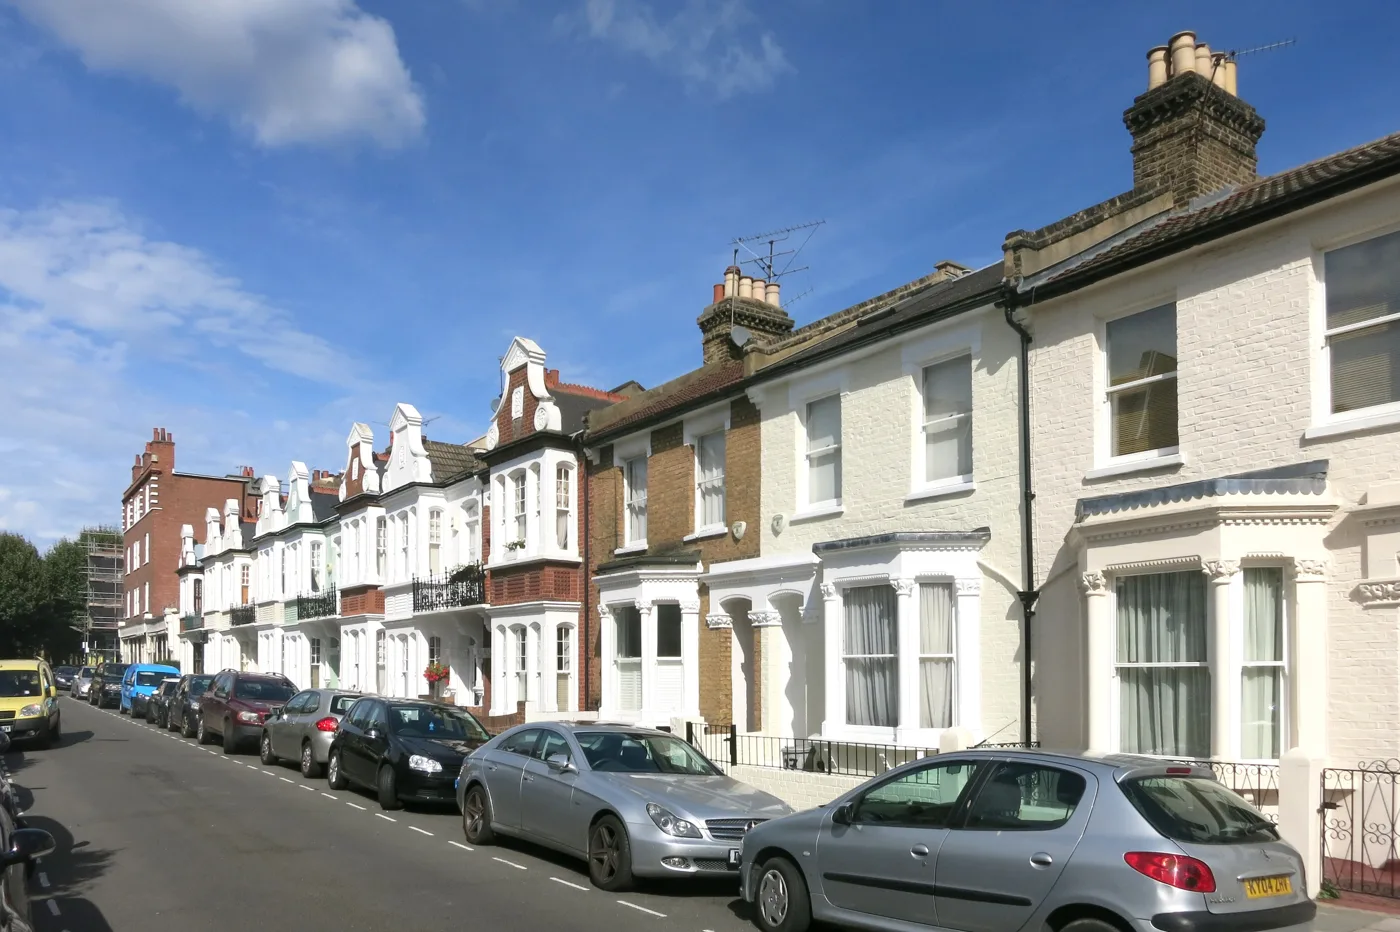

The borough average fell £72,836 in the year to July, to £738,048. Flats are down 10 per cent, and only 536 sales have been registered for January to May.
The average home in Hammersmith and Fulham sold for £738,048 in July. That is £72,836 less than a year earlier, and it is the lowest July figure the borough has recorded since 2013.
The numbers come from the UK House Price Index for July 2026, published by HM Land Registry on 16 September. It is built from actual completed sales registered with the Land Registry, which makes it slower than an estate agent’s asking price index but a great deal harder to argue with.
Two things are true at once this month, and both matter.
- The year-on-year fall is still large. Down 9.0 per cent, against 3.3 per cent across London and a 1.1 per cent rise across England.
- The monthly direction has turned. July was up 1.4 per cent on June, the second monthly rise in a row after the borough bottomed out at £715,438 in May.
What each kind of home is worth now
| July 2026 average | Change on July 2025 | |
|---|---|---|
| Detached | £1,716,974 | -6.1% |
| Semi-detached | £1,503,460 | -4.4% |
| Terraced | £1,139,759 | -6.7% |
| Flat or maisonette | £568,235 | -10.0% |
| First-time buyer | £629,368 | -9.4% |
| All homes | £738,048 | -9.0% |
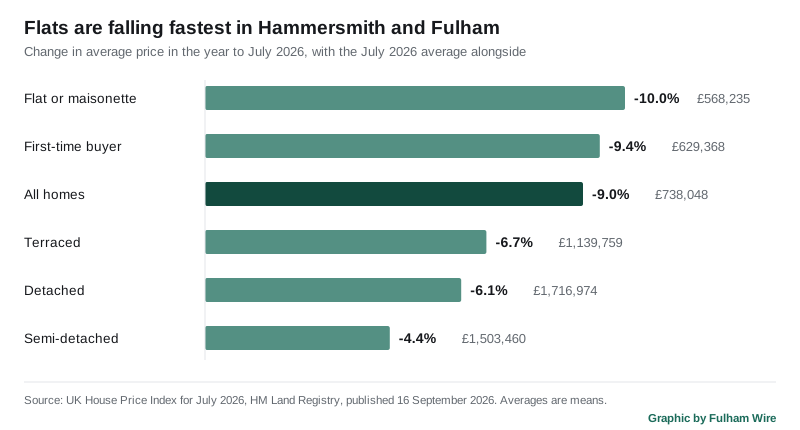
Flats are taking the fall. They are down 10.0 per cent on the year, worse than any other type, and they are the type that matters most here. Before this year, the last time the borough’s average flat cost less than £568,235 was May 2020.
That is also why the first-time buyer average has dropped 9.4 per cent. In this borough a first purchase is usually a flat.
How far this has gone
The borough’s average peaked at £889,834 in March 2023. It is now £151,786 below that, a fall of 17.1 per cent over three and a bit years.
Look at July alone and the pattern is clearer. July 2025 was £810,884. July 2024 was £825,377. July 2023 was £849,204. You have to go back to July 2013, when the average was £648,881, to find a July below this one. Before 2026, the last month of any kind with an average below £738,048 was February 2021.
Sales have almost stopped
Price is only half of it. The other half is how many people are actually moving, and on the figures registered so far, very few are.
The Land Registry has recorded 536 sales in Hammersmith and Fulham for January to May 2026. The same five months last year produced 1,075. In 2024 it was 865 and in 2023 it was 792. Sales volumes go back to 1995 in this dataset, and only 2009, with 440, has been lower for those months.
One caveat, and it is a real one. Sales volumes take months to complete, because a sale only appears once it is registered. The most recent months will rise as registrations catch up. The 536 is a floor, not a final figure. Even so, the gap on 2025 is far too big to be an artefact of the lag, and part of last year’s total was itself a spike: March 2025 alone recorded 476 sales as buyers rushed to complete before the stamp duty thresholds changed on 1 April.
How this compares with next door
| Area | July 2026 average | Change on July 2025 |
|---|---|---|
| Kensington and Chelsea | £1,232,640 | -14.1% |
| Hammersmith and Fulham | £738,048 | -9.0% |
| Wandsworth | £686,076 | -5.5% |
| London | £550,037 | -3.3% |
| England | £293,479 | +1.1% |
The pattern across London is consistent and it is about price. The more expensive the area, the harder it is falling. Kensington and Chelsea is down more than this borough, Wandsworth across the bridge is down less, and outside London prices are still rising.
Read the number correctly
The UK House Price Index average is a mean, not a median. A handful of multi-million-pound sales on the river pull the borough figure up in a way they do not pull up the price of a two-bedroom flat off Munster Road. In a borough with this much spread between the top and the bottom of the market, the mean moves around more than most people’s homes do.
The figures are also provisional. HM Land Registry revises them as more sales are registered. That has already happened to the month we reported last time: in August we gave June 2026 as £725,562 and a 13.3 per cent annual fall, and the June figure has since been revised to £728,043 and 13.0 per cent.
What it means for you
If you are selling. The annual fall is easing, but it is still a fall, and the market is thin. Fewer than half as many homes changed hands in the first five months of this year as in the same months of 2025. A price set from a 2023 valuation is about 17 per cent above where the index now sits.
If you are buying, and especially for the first time. The average flat is £63,135 cheaper than it was in July 2025. Stamp duty has not moved with the market. HMRC’s first-time buyer relief gives no SDLT up to £300,000, and cannot be claimed at all if the price is over £500,000. The borough’s average first purchase is £629,368.
If you are staying put. None of this changes what you pay. Council tax bands are set on April 1991 values and are unaffected by the index. Our council tax bands page has the current charges, and our Fulham house prices page has the longer view by street type.
Sources
- UK House Price Index for July 2026, HM Land Registry, published 16 September 2026.
- UK House Price Index data for Hammersmith and Fulham, for the monthly averages, the breakdown by property type, the first-time buyer average and the sales volumes back to 1995.
- UK House Price Index data for Kensington and Chelsea, Wandsworth, London and England, same release, for the comparison table.
Figures in this article come from the UK House Price Index for July 2026, published by HM Land Registry, and contain public sector information licensed under the Open Government Licence v3.0.
Have your say