
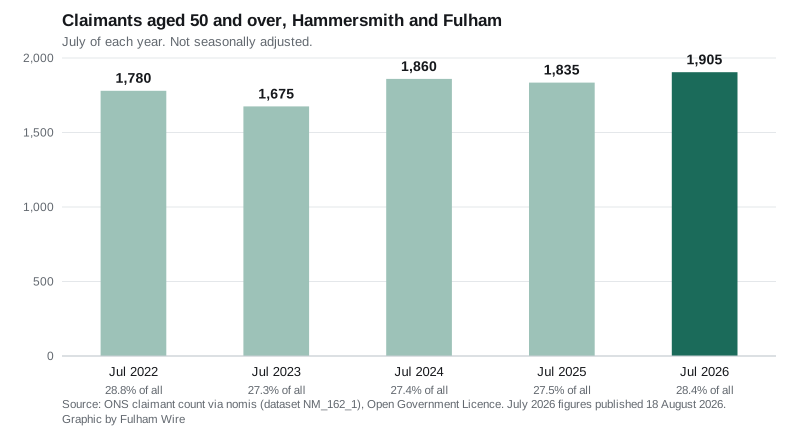
The borough total barely moved in a year, but 1,905 over-50s are now claiming, the most since March 2022. Under-25s held flat and the 25 to 49 group fell.
There were 6,700 people claiming out-of-work benefits in Hammersmith and Fulham in July. That is 30 more than a year earlier, a change of less than half a per cent.
The headline figure has barely moved. What has changed is who is claiming. The number of claimants aged 50 and over rose by 70 in the year, to 1,905. The 25 to 49 group fell by 45. The under-25s did not move at all.
The figures come from the ONS claimant count, published through nomis under the Open Government Licence. July’s numbers were released on 18 August 2026 in the ONS labour market overview.
The over-50 number is the one to watch
At 1,905, claimants aged 50 and over are at their highest for any July since 2021, when the count was still falling back from the pandemic. Setting aside May this year, when it reached 1,910, the borough has not recorded a month at this level since March 2022.
They now make up 28.4 per cent of all claimants in the borough, up from 27.5 per cent a year ago.
The three age bands moved in different directions over the year to July 2026:
- aged 50 and over: 1,905, up from 1,835
- aged 25 to 49: 3,945, down from 3,990
- aged 16 to 24: 845, unchanged
The split between men and women hardly shifted. There were 3,645 male claimants and 3,055 female, against 3,630 and 3,040 in July 2025.
Where the borough sits in London
The claimant count is also published as a rate. In Hammersmith and Fulham it was 4.8 per cent of residents aged 16 to 64 in July, the same as a year ago.
That is below the London figure of 5.6 per cent, which itself fell from 5.7 per cent over the year. It is well above the Great Britain rate of 3.9 per cent, unchanged on the year.
Across the 33 London local authorities, the borough ranks 21st on that rate. It sits in a band of its own, between two very different sets of neighbours.
| Borough | Claimant rate, July 2026 |
|---|---|
| Brent | 7.2% |
| Ealing | 6.5% |
| Hounslow | 5.0% |
| Hammersmith and Fulham | 4.8% |
| Westminster | 4.1% |
| Wandsworth | 4.0% |
| Kensington and Chelsea | 3.5% |
The highest rates in London in July were in Barking and Dagenham, Haringey and Newham, all on 7.5 per cent. The lowest, outside the City of London, were Richmond upon Thames at 2.6 per cent and Kingston upon Thames at 3.2 per cent.
What the claimant count actually counts
Two caveats matter before anyone reads too much into a 30-person change.
First, this is not an unemployment rate. ONS is explicit that the claimant count does not attempt to measure unemployment. It combines people on Jobseeker’s Allowance with people on Universal Credit who are required to look for work as a condition of their claim. People looking only for part-time work generally do not qualify, so the count runs well below the true unemployment level. ONS says its value is as a proxy for how things change over time in small areas, which is exactly how it is used here.
Second, the local figures are not seasonally adjusted. Month-to-month moves partly reflect the time of year, which is why the comparisons in this article are July against July.
What it means for you
If you are over 50 and out of work in the borough, the figures say you are not an outlier. The over-50 group is the only one of the three that has grown in the past year, and it is now close to three in ten of everyone claiming locally.
One route worth knowing about is the council’s own adult learning service. It says it runs more than 450 courses at venues across the borough. Many qualification courses are free for people on benefits. Claims themselves are made through GOV.UK, not the council.
The other half of the local economic picture is property. Our report on the borough’s house prices falling £111,315 in a year covers that, and the Fulham house prices page tracks it street by street.
ONS publishes the next set of figures, covering August 2026, on 15 September.
Update, 16 September 2026
The ONS revised the July 2026 figures for Hammersmith and Fulham when it published August’s count on 15 September. On the revised figures:
- the borough total for July is 6,555, not 6,700, which is 115 fewer than July 2025 rather than 30 more
- claimants aged 50 and over were 1,875, not 1,905, still up 40 on the year
- claimants aged 25 to 49 were 3,850, not 3,945
- claimants aged 16 to 24 were 835, not 845
- the claimant rate was 4.7 per cent, not 4.8 per cent
The rest of this article reports the figures as first published. The August figures, in which the over-50 count reached its highest level since March 2022, are in our August 2026 claimant count report.
Have your say