
The borough average fell 13.3% in the year to June 2026, to £725,562. That is the steepest annual drop since 2009, and every type of home is down.
The average home in Hammersmith and Fulham was worth £725,562 in June. That is £111,315 less than a year earlier.
The fall of 13.3 per cent comes from the UK House Price Index, the official measure produced by HM Land Registry from completed sales. No annual fall this steep has been recorded in the borough since July 2009, when the figure was 13.5 per cent. The series goes back to January 1995 and its worst reading is March 2009, at 18.3 per cent.
Twelve straight months of falls
June 2026 was the twelfth month in a row in which the borough’s average price was lower than the same month a year before. The run started in July 2025.
The borough peaked in March 2023, at £889,834. The June figure is £164,272 below that, a drop of 18.5 per cent from the top of the market. No month between June 2020 and December 2025 recorded an average as low as £725,562.
One number cuts against the trend. June was actually 1.1 per cent up on May, when the average stood at £717,636. The annual comparison worsened anyway, because the summer of 2025 was higher still.
Every type of home is worth less
The fall is not confined to one part of the market. Flats and maisonettes, which make up most sales in this borough, are down the most.
| Property type | June 2025 | June 2026 | Change |
|---|---|---|---|
| Detached | £1,914,522 | £1,668,347 | -12.9% |
| Semi-detached | £1,645,896 | £1,446,080 | -12.1% |
| Terraced | £1,264,148 | £1,109,048 | -12.3% |
| Flat or maisonette | £650,536 | £561,089 | -13.7% |
| First-time buyer | £716,071 | £619,553 | -13.5% |
The first-time buyer average is worth pausing on. At £619,553 it is £96,518 lower than a year ago, which sounds like relief. It is still far above the £500,000 ceiling for first-time buyer stamp duty relief. Buy at the local average as a first-time buyer here and you get no discount at all.
The dearer the borough, the harder the fall
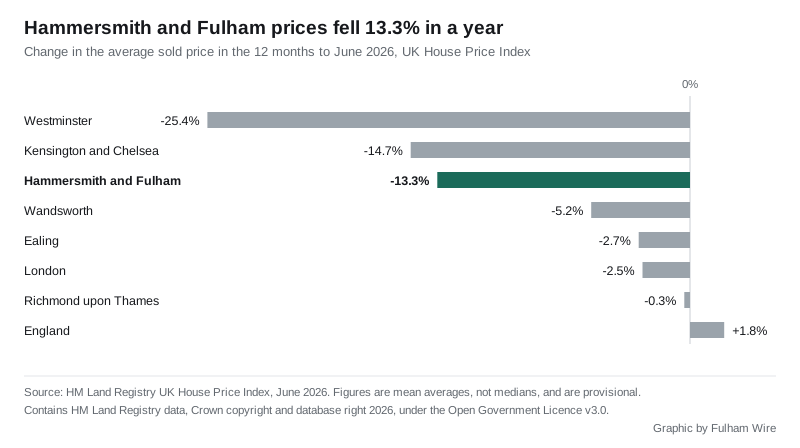
Set Hammersmith and Fulham against its neighbours and a pattern appears. The steepest falls are in the most expensive boroughs. England as a whole is still rising.
| Area | Average price | Annual change |
|---|---|---|
| Westminster | £854,198 | -25.4% |
| Kensington and Chelsea | £1,250,149 | -14.7% |
| Hammersmith and Fulham | £725,562 | -13.3% |
| Wandsworth | £680,105 | -5.2% |
| Ealing | £575,814 | -2.7% |
| London | £553,870 | -2.5% |
| Richmond upon Thames | £818,949 | -0.3% |
| England | £293,262 | +1.8% |
Richmond upon Thames, which is not far off Hammersmith and Fulham on price, is essentially flat at 0.3 per cent down. Wandsworth, just across Wandsworth Bridge, has lost 5.2 per cent. The gap between our borough and the one over the river is eight percentage points in a single year.
Fewer sales are going through
Land Registry also counts how many homes actually changed hands. From January to April this year it has recorded 418 sales in the borough, against 937 in the same four months of 2025.
Two things need saying about that comparison, and both cut against a simple headline:
- 476 of the 2025 sales fell in March alone. The temporary stamp duty thresholds ended on 31 March 2025, and the nil-rate band dropped back from £250,000 to £125,000 from 1 April. Buyers rushed to complete before the deadline.
- Sales counts for recent months are incomplete. Registration lags completion, so the 2026 figures will rise as more sales are recorded.
Strip out March from both years and the picture is still down: 461 sales in January, February and April 2025, against 322 in the same three months of 2026.
What the number is, and what it is not
The UK House Price Index average is a mean, not a median. It is also adjusted for the mix of what sold, so a quiet month for large houses does not by itself move it. That makes it the right measure for tracking direction over time, and the wrong one for answering “what would my flat fetch”.
For that, our Fulham house prices page uses HM Land Registry’s Price Paid record instead, sale by sale. On that measure the borough median across the year to June 2026 was £675,000, and the SW6 median was £777,500. Fulham proper is dearer than the borough it sits in.
The June 2026 index figures are provisional. Land Registry revises them as more sales are registered, so the 13.3 per cent may move in either direction.
What it means for you
If you are selling. The direction has been one way for a year, and the borough is falling faster than London as a whole. An asking price set from a March 2023 valuation sits about 23 per cent above where the index is now.
If you are buying. A flat in this borough costs on average £89,447 less than it did in June 2025. The stamp duty position has not moved with it, so anything over £500,000 carries the full bill even for a first purchase.
If you are staying put. The figure changes nothing you pay day to day. Council tax bands are set on April 1991 values and are not affected by any of this.
Figures in this article come from the UK House Price Index for June 2026, published by HM Land Registry, and contain public sector information licensed under the Open Government Licence v3.0.
Update, 20 September 2026: HM Land Registry has revised the June 2026 figures. The borough average for June is now £728,043, not the £725,562 given here, and the annual fall is 13.0 per cent rather than 13.3 per cent. On the revised figure the drop over the year to June is £108,834. The July 2026 figures, published on 16 September, are in our July report.
Have your say