
The borough average rose to £754,825 in August, a third monthly rise since May's low. Prices are still 5.1 per cent down on a year ago, and flats are down most.
House prices in Hammersmith and Fulham have now risen for three months in a row. The average home sold for £754,825 in August, up 1.6 per cent on July.
That is still £40,376 less than in August 2025, a fall of 5.1 per cent. But the annual fall is shrinking fast. It was 12.1 per cent in June and 8.4 per cent in July.
The figures come from the UK House Price Index for August 2026, published by HM Land Registry on 21 October. The index is built from completed sales registered with the Land Registry. It is a mean average, so a handful of very expensive sales can move it, and it is not the price of a typical home.
Three rises since the May low
The borough average fell every month from August 2025 to May 2026. The Land Registry’s monthly series puts the low at £721,339 in May. Since then:
- June: £735,628, up 2.0 per cent
- July: £742,848, up 1.0 per cent
- August: £754,825, up 1.6 per cent
That is £33,486 back since May, or 4.6 per cent.
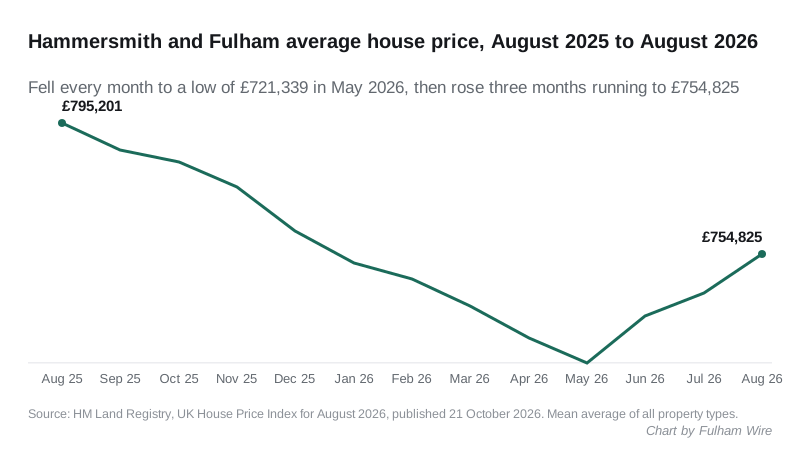
Earlier months have been revised up. When we reported the July figures in September, the index put July at £738,048 and the May low at £715,438. This release puts them at £742,848 and £721,339. Revisions like this are normal, because late registrations keep arriving for months, but they mean the recovery started from a slightly higher floor than it first looked.
Flats are still furthest behind
| August 2026 average | Change on August 2025 | |
|---|---|---|
| Detached | £1,763,936 | -0.8% |
| Semi-detached | £1,544,924 | +0.9% |
| Terraced | £1,172,812 | -2.2% |
| Flat or maisonette | £579,711 | -6.4% |
| First-time buyer | £643,534 | -5.5% |
| All homes | £754,825 | -5.1% |
Houses have almost caught up with last year. Semi-detached homes are now 0.9 per cent up on August 2025, and detached homes are only 0.8 per cent down.
Flats are the exception, and they are most of the market here. The average flat is still 6.4 per cent down on a year ago, at £579,711. That drags the first-time buyer average down with it, because a first purchase in this borough is usually a flat.
Buyers paying cash and buyers with a mortgage are paying much the same. The index puts the cash average at £751,717 and the mortgage average at £756,219.
How the borough compares
| August 2026 average | Change on August 2025 | |
|---|---|---|
| Kensington and Chelsea | £1,204,072 | -13.8% |
| Wandsworth | £694,210 | -5.3% |
| Hammersmith and Fulham | £754,825 | -5.1% |
| London | £554,430 | -2.2% |
| Hounslow | £528,051 | -1.5% |
| Richmond upon Thames | £813,931 | 0.0% |
| England | £293,525 | +0.4% |
| Ealing | £589,875 | +1.8% |
The borough is still falling faster than London as a whole. It sits close to Wandsworth, across the river. Kensington and Chelsea, next door, is down far more, while Ealing and Richmond to the west are level or rising.
A long way below the peak
The borough average peaked at £889,834 in March 2023. August’s figure is £135,009 below that, a fall of 15.2 per cent.
On August figures alone, only one year since 2013 has been lower. August 2019 came in at £753,952, a few hundred pounds below this year. August 2013 was £648,285.
Sales are still thin
The index also counts how many sales have been registered. For January to June 2026 it has 696 in the borough. The same six months produced:
- 1,226 in 2025, including a one-off rush of 476 sales in March
- 1,005 in 2024
- 963 in 2023
In 2009, after the financial crash, the same months produced 596. Volumes for the latest months will rise as registrations catch up, so the gap will narrow. It is very unlikely to close.
What it means for you
- If you are selling, the direction has changed. Three monthly rises do not undo a 15 per cent fall from the peak, but buyers can no longer assume prices will be lower next month.
- If you are buying a flat, prices are still well below last year, and flats are recovering more slowly than houses. That gap is the opening for first-time buyers.
- If you are buying a house, the discount on last year has almost gone.
- Your own street can be very different. These are borough-wide averages. Our Fulham house prices page breaks prices down by area and type.
The September figures are due from the Land Registry next month, and we will report them.
Sources
- HM Land Registry, UK House Price Index for August 2026, published 21 October 2026.
- UK House Price Index data for Hammersmith and Fulham, read 25 October 2026, for the monthly averages, the type, buyer and funding figures, the March 2023 peak, the August figures back to 2013 and the January to June sales volumes.
- The same dataset for Kensington and Chelsea, Wandsworth, Hounslow, Richmond upon Thames, Ealing, London and England, read 25 October 2026.
Have your say