
The average home in Hammersmith and Fulham fell to £732,590 in September, down 4.5% in a month. Prices are now 6.8% lower than a year ago.
The average home in Hammersmith and Fulham sold for £732,590 in September, down 4.5 per cent on August. That ends three months of rises since May.
It is the borough’s biggest one-month fall since October 2021. Prices are now 6.8 per cent lower than a year ago, or £53,847 less than the £786,437 of September 2025.
The figures come from HM Land Registry’s UK House Price Index for September 2026, published on 18 November. The index uses a mean average, not a median, so a handful of very expensive or very cheap sales can move it.
Overview
- September 2026: £732,590, down 4.5% on August and down 6.8% on a year earlier.
- August, revised: now £767,083, up from the £754,825 first published last month.
- Flats: £562,710, down 8.0% on a year ago, the steepest fall of any type.
- London: £545,579, down 3.5% on a year ago.
A recovery, then a fall
May was the low point of the past year. The latest release puts the monthly averages at:
- May: £723,294
- June: £749,789, up 3.7 per cent
- July: £757,487, up 1.0 per cent
- August: £767,083, up 1.3 per cent
- September: £732,590, down 4.5 per cent
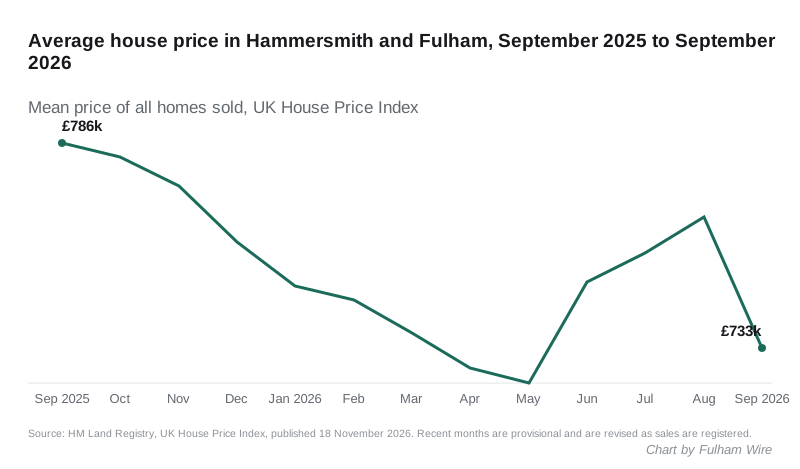
Last month’s release had August at £754,825. This one puts it at £767,083, more than £12,000 higher. Each month’s figure moves as late sales are registered, and the newest months move most. September’s figure is provisional too, and could be revised either way next month.
Every type of home is down on a year ago
| Type | September 2026 average | Change on September 2025 |
|---|---|---|
| Detached | £1,711,106 | -2.6% |
| Semi-detached | £1,479,566 | -2.4% |
| Terraced | £1,139,132 | -4.1% |
| Flat or maisonette | £562,710 | -8.0% |
| First-time buyer | £623,860 | -7.4% |
| All homes | £732,590 | -6.8% |
Flats fell furthest, and the first-time buyer average is down by a similar amount.
How the borough compares
| September 2026 average | Change on September 2025 | |
|---|---|---|
| Kensington and Chelsea | £1,170,938 | -15.6% |
| Hammersmith and Fulham | £732,590 | -6.8% |
| Wandsworth | £692,067 | -5.2% |
| Hounslow | £513,853 | -3.6% |
| London | £545,579 | -3.5% |
| Richmond upon Thames | £796,378 | -2.6% |
| England | £292,998 | +0.8% |
| Ealing | £578,526 | +1.3% |
Every one of these neighbours fell between August and September, but none by as much as Hammersmith and Fulham. Kensington and Chelsea fell 3.8 per cent in the month, and London as a whole 1.4 per cent.
What it means for you
- If you are selling, the summer rises were not the start of a clear recovery. Price from what has sold nearby in the past few months, not from last year.
- If you are buying a flat, prices are 8 per cent below a year ago. That is the biggest discount in the borough.
- Do not read too much into one month. Fewer than 200 sales a month are being registered in the borough, and the August figure has just moved by £12,000. Our Fulham house prices page shows prices by area and type.
The October figures are due from the Land Registry in December.
Sources
- HM Land Registry, UK House Price Index for September 2026, published 18 November 2026.
- UK House Price Index data for Hammersmith and Fulham, read 18 November 2026, for the monthly averages, the type and first-time buyer figures, and the monthly changes back to 2020.
- The same dataset for Kensington and Chelsea, Wandsworth, Hounslow, Richmond upon Thames, Ealing, London and England, read 18 November 2026.
Have your say